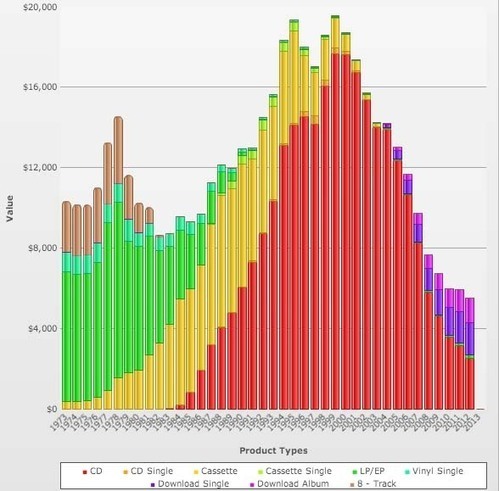
In terms of revenue, the record industry has contracted 75% over the past 15 years. It reached its inflation-adjusted peak in 1999.
This massive revenue contraction happened despite a 75% aggregate increase in music consumption since 1999.
This implies an overall price traction drop of 94%. Considering that in parallel, the share of revenue earned by artists has fallen 50-70%, it looks like most artists are now making around 2% of what they would have off the same record sales 15 years ago.
I wonder how the record industry will respond to the upcoming 50% contraction they will experience in 5 years once people stop buying CDs entirely? That will probably suck for them. The artists probably won’t care much. If current rockstars are fine with earning just 2% of what the last generation made off their recordings, the next generation will probably be fine with earning 1% as much.

5 Responses to “40 years of music sales data in one handy chart”
February 27
Lynn BenderGood riddance to the record industry.
February 27
Earle HagerWhat of that bump was the replacement of old records into CDs or the continually reissuing of box sets?
February 28
Luke CockerhamSo this is why it’s called Rockstar Research.
March 2
BluesBroSome sales are going up again e.g. vinyl, but mostly what is happening is that some of the fat middlemen are being replaced with slimmer middle men.
March 3
Robin Gane-McCallarecord industry has *contacted* 75% over the past 15 years
I think you mean contracted